
As a data analyst,
![]() transitioning from Python to SQL was a pivotal step in my journey of working with large datasets. While Python is powerful for data analysis and machine learning, SQL (Structured Query Language) provides unmatched capabilities for accessing and manipulating data directly from databases. SQL allows us to extract valuable insights from complex databases, clean and transform data, and analyze information for decision-making—all with just a few lines of code.
transitioning from Python to SQL was a pivotal step in my journey of working with large datasets. While Python is powerful for data analysis and machine learning, SQL (Structured Query Language) provides unmatched capabilities for accessing and manipulating data directly from databases. SQL allows us to extract valuable insights from complex databases, clean and transform data, and analyze information for decision-making—all with just a few lines of code.
The Power of SQL for Data Analysis
When working with large datasets, SQL becomes essential for performing operations such as filtering, aggregating, joining tables, and extracting specific records. SQL offers a standardized way of interacting with relational databases, allowing data analysts to efficiently query data, apply filters, and prepare datasets for analysis. One of the biggest advantages of SQL is that it is designed to handle large volumes of data stored in databases—something that can be cumbersome with Python when the data is too large to fit into memory.
Here are some practical ways SQL can be used to clean, prepare, and analyze data for decision-making:
1. Cleaning Data
Cleaning data is often the first step in any analysis. SQL provides robust tools for handling missing data, removing duplicates, and standardizing information. Here’s an example of how SQL can be used to clean data:
-- Remove rows with missing values in key columns
DELETE FROM customer_data
WHERE customer_name IS NULL
OR purchase_amount IS NULL;

-- Standardize the format of phone numbers
UPDATE customer_data
SET phone_number = REPLACE(phone_number, '-', '')
WHERE phone_number LIKE '%-%';
In this example, I’m cleaning a customer data table by removing rows where important fields are missing (such as `customer_name` or `purchase_amount`), and then standardizing the format of phone numbers by removing hyphens.
2. Preparing Data for Analysis
Once the data is cleaned, we often need to transform it into a more suitable format for analysis. SQL’s aggregation and transformation functions make it easy to prepare data for advanced analytics. Below is an example of how SQL can be used to aggregate customer purchase data:
-- Calculate total purchases and average purchase value for each customer
SELECT customer_id,
       COUNT(purchase_id) AS total_purchases,
       SUM(purchase_amount) AS total_spent,
       AVG(purchase_amount) AS avg_purchase_value
FROM sales_data
GROUP BY customer_id;
This query calculates key metrics such as the total number of purchases, the total amount spent, and the average purchase value for each customer. This type of aggregation is incredibly useful for identifying high-value customers and understanding overall spending behavior.
3. Analyzing Data
Finally, SQL is excellent for performing detailed analysis on datasets. Whether you’re trying to identify trends, segment customers, or compare performance over time, SQL enables quick and efficient data analysis. Here’s an example of how SQL can be used to analyze sales performance by product category:
-- Analyze total sales and average order value by product category
SELECT category_name,
       SUM(purchase_amount) AS total_sales,
       AVG(purchase_amount) AS avg_order_value
FROM sales_data
JOIN products ON sales_data.product_id = products.product_id
GROUP BY category_name
ORDER BY total_sales DESC;
This query joins two tables—`sales_data` and `products`—to calculate total sales and the average order value for each product category. The results are then sorted by total sales in descending order, providing insights into the top-performing categories.
Key Skills for Data Analysts: SQL, Data Querying, Database Management, and ETL (Extract, Transform, Load)
Throughout my experience with SQL, I have developed several core skills that are crucial for data analysts:

1. SQL and Data Querying
SQL is the foundation of data querying, allowing data analysts to extract valuable insights directly from complex databases. I’ve used SQL extensively for querying relational databases, performing operations such as filtering, joining, grouping, and aggregating data. From calculating customer lifetime value (CLTV) to analyzing sales performance across different dimensions, SQL’s powerful querying capabilities allow me to make data-driven decisions quickly and efficiently.

2. Database Management
Database management is a critical skill for any data analyst working with large datasets. In my projects, I’ve designed database schemas that efficiently organize data and ensure optimal performance. I’m proficient in working with relational databases like MySQL and PostgreSQL, where I regularly create and manage tables, set up relationships between entities, and ensure data integrity. I’m also experienced in indexing, optimizing queries, and managing database storage to improve performance and handle large datasets seamlessly.

3. ETL (Extract, Transform, Load)
The ETL process—Extract, Transform, Load—is a key component of preparing data for analysis. ETL allows us to move data from various sources, clean and transform it, and then load it into the target database for analysis. I’ve worked extensively with SQL during all stages of the ETL process:
- Extract: I’ve extracted data from multiple sources, such as eCommerce platforms, hospital records, and customer transaction logs. Using SQL, I can pull data from different tables or even from external data sources such as APIs and flat files (CSV).
- Transform: Once extracted, the data often requires cleaning and transformation to fit the desired format. Using SQL queries, I perform tasks such as removing duplicates, handling missing values, standardizing formats, and applying business logic (e.g., converting currencies or mapping categories). These transformations ensure that the data is ready for analysis.
- Load: After transforming the data, I load it into a target database or data warehouse. Using SQL, I ensure that data is inserted correctly into relevant tables, maintaining relationships between entities, such as customers, orders, and products. During this stage, I also ensure that the database schema supports efficient querying and analysis.
The ETL process is particularly important when working with large, complex datasets, as it ensures that the data is properly organized, cleaned, and ready for analysis. My hands-on experience with ETL processes has allowed me to streamline workflows, optimize data pipelines, and ensure that the data used for decision-making is accurate and reliable.
Understanding ER Diagrams and Database Schemas
Before diving into the practical applications, it’s important to understand the concept of an Entity-Relationship Diagram (ERD) and how it helps visualize the database structure. An ERD represents the entities (such as Customers, Orders, Products) and their relationships within a database. It serves as a blueprint for designing the database schema, ensuring that data is stored in an organized and efficient manner.
When designing a database schema, choosing the right structure depends on the complexity and requirements of the system. For my projects, I used different schemas to handle various business needs:
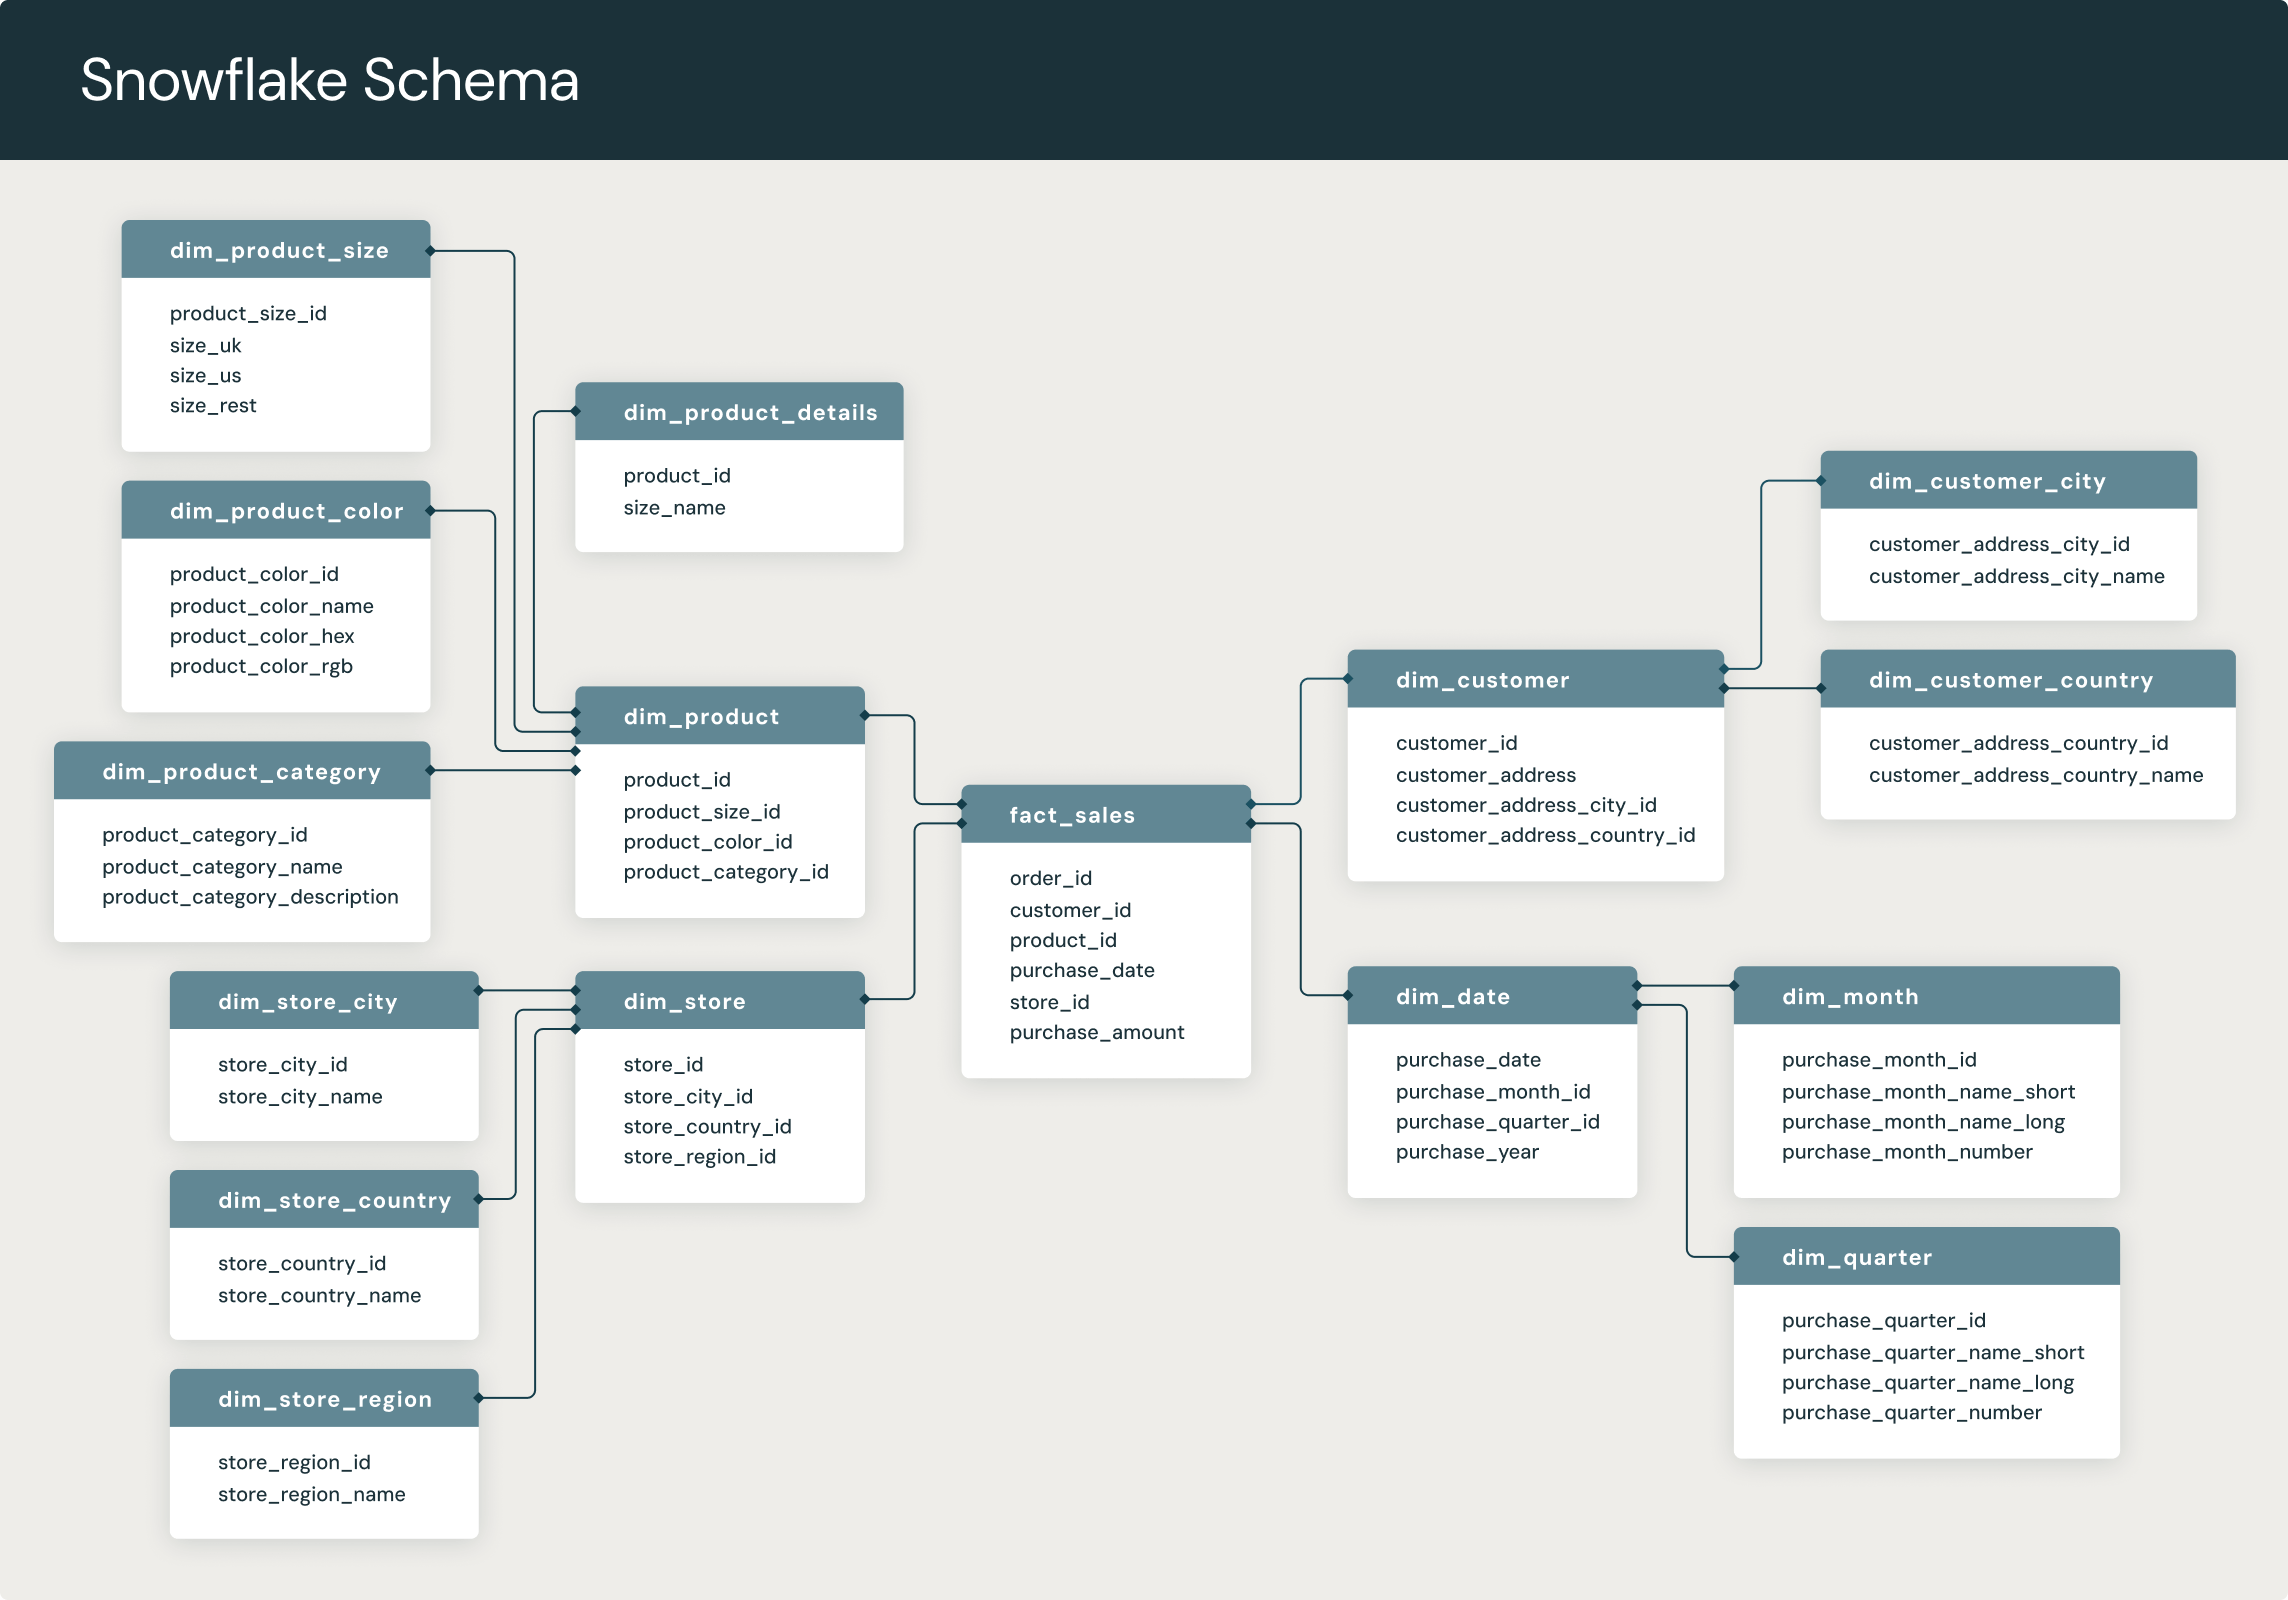
- Snowflake Schema: A normalized version of the star schema where dimension tables are split into multiple related tables, helping eliminate redundancy.
- Fact Constellation: A complex schema involving multiple fact tables, allowing for more sophisticated queries and reporting across different processes.
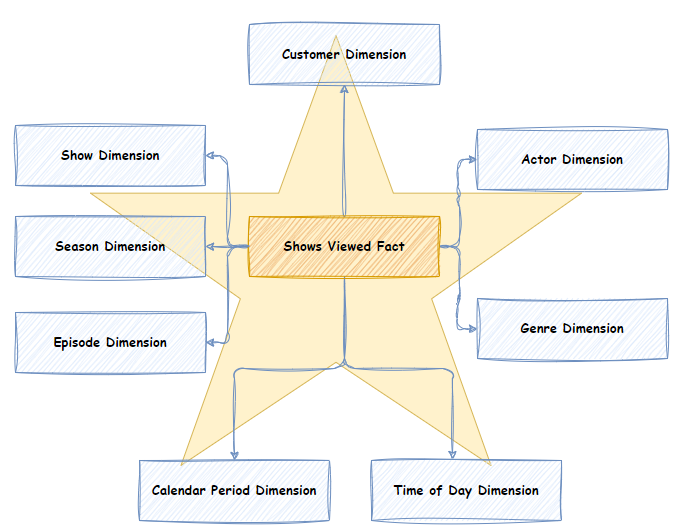
- Star Schema: A simpler structure where a central fact table is linked to several dimension tables, providing efficient querying in smaller datasets.

My Experience with SQL: Building ERD and Schema Design for Projects
Building an ERD for Amazon using Snowflake Schema and Fact Constellation Mix

For the Amazon project, the challenge was to represent the complexity of an eCommerce platform. I used a combination of Snowflake schema and Fact constellation schema to accommodate the intricate relationships between customers, orders, products, reviews, and payments.
The Snowflake schema allowed for efficient storage by normalizing dimension tables, eliminating data redundancy. For example, I split the `product` entity into related tables such as `product`, `category`, and `supplier`. Additionally, I used multiple fact tables to handle different business processes (orders, payments, and reviews), forming a Fact constellation. This schema provided flexibility and allowed for complex querying, such as tracking customer purchase patterns over time or analyzing product ratings in relation to sales.
- Customers: Entity representing individuals shopping on Amazon, with attributes like customer ID, name, and address.
- Products: Entity representing items sold, including product ID, name, category, and price.
- Orders: Entity representing customer orders, with order ID, customer ID (foreign key), and total amount.
- Payments: Captures payment information, with payment ID and linked order ID.
- Reviews: Stores product reviews, capturing the customer and product ID.
Once I designed the schema and populated the database, I ran various queries to ensure it supported business analysis. I used SQL to calculate metrics such as average order value, product review scores, and customer lifetime value (CLTV). The combination of Snowflake and Fact constellation allowed for efficient queries across multiple dimensions and fact tables.
Schema Design for a Hospital Using Star Schema

In contrast to the eCommerce system, I used a Star schema for the hospital management system. This was because the hospital data structure was less complex, and the star schema’s simpler structure allowed for efficient queries.
The star schema featured a central fact table—representing treatments and appointments—and dimension tables such as patients, doctors, and treatments. This schema provided the flexibility needed to query patient treatment history, analyze doctor performance, and generate reports on treatment outcomes.
- Patients: Entity representing patient details, with patient ID, name, and age.
- Doctors: Entity representing doctor information, with doctor ID, specialization, and availability.
- Appointments: Entity linking patients and doctors, containing appointment date and treatment details.
- Treatments: Entity representing treatments provided to patients, capturing patient ID and doctor ID.
I tested the schema by running SQL queries to analyze doctor appointment schedules, calculate average treatment durations, and generate patient medical histories. The simplicity of the star schema ensured fast query performance, especially when generating summary reports.
Key Project Takeaways
In both the Amazon and hospital projects, SQL played a vital role in building the schema, adding data, and performing analyses. The combination of different schemas—Snowflake and Fact constellation for Amazon and Star schema for the hospital—allowed me to tailor the database design based on the system's complexity. These schemas ensured the data was organized in a way that supported efficient querying and analysis.
Conclusion
SQL is an essential tool for data analysts, allowing us to extract insights from complex databases, prepare data for analysis, and build efficient database schemas. Understanding the role of ER diagrams and selecting the right schema for each project is key to optimizing database performance. Whether working with eCommerce systems like Amazon or hospital management data, SQL provides the flexibility and power to handle large datasets and uncover valuable insights.
Comments
Post a Comment